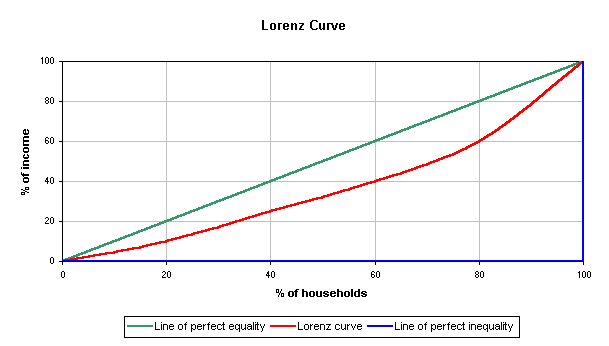
The Lorenz curve is a graphical representation of the proportionality of a distribution (the cumulative percentage of the values). It is often used to represent income distribution, where it shows for the bottom x% of households, what percentage y% of the total income they have. The percentage of households is plotted on the x-axis, the percentage of income on the y-axis.
No comments:
Post a Comment