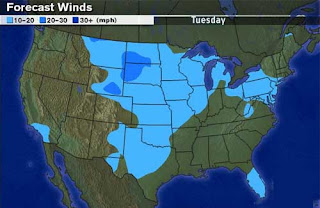
An isoline map is a map with continuous lines joining points of the same value. Meteorologists use isolines to quickly show temperature difference on a map. The hottest areas are often colored red, the warm areas yellow, and the cold areas blue. Isolines are effective because they quickly communicate the distributions being examined. In addition to weather, isolines can also be used to describe any other type of data. Another common use of isolines is to show areas that are of the same elevation.
No comments:
Post a Comment